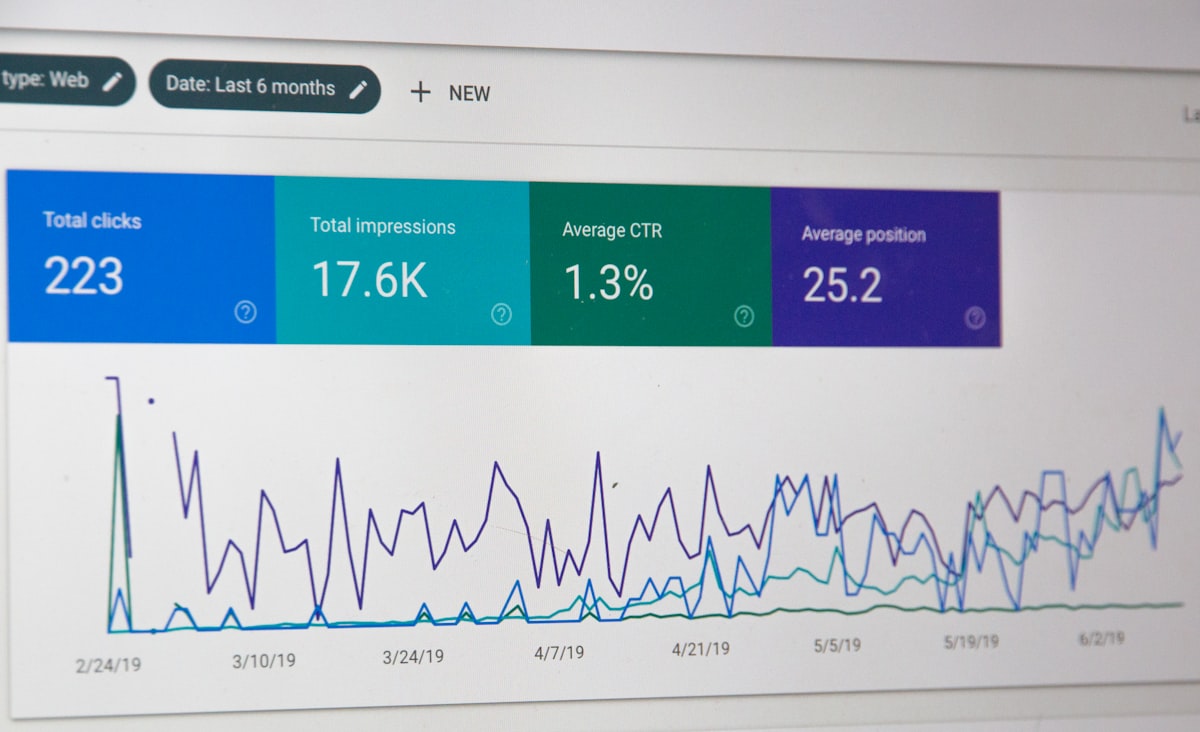
Last-click attribution is quietly defunding your best channels by assigning 100% of each sale’s credit to the final touchpoint — while email, SMS, and social, the channels that built intent and nurtured the relationship — receive nothing. The Attribution Map reads the same event stream through three lenses: first touch (which channel acquired the member), assists (which channels moved them toward purchase), and last touch (which channel closed). Running it across your converting members usually shows email and SMS drive far more revenue than last-click ever credits them with.
Of the three layers this week, this is the one that determines whether the other two survive a budget meeting. You can build a unified member view and a well-sequenced cascade, and still watch the email and SMS programs that power them get defunded, because the attribution model you report on doesn’t credit them.
The culprit is last-click attribution, and it’s the default in most analytics setups, so it’s rarely a deliberate choice. It simply assigns 100% of a sale’s credit to the final channel the member interacted with before making a purchase. That sounds reasonable until you trace a member’s actual journey.
A member sees a post on social and follows you. Over three weeks, they open three of your emails, each building familiarity and intent. They get an SMS about a closing allocation, click it, browse, and don’t buy. Two days later, they search for your brand name directly and make a purchase. Last-click gives search, often branded search you’d have won regardless, the entire sale. Social, email, and SMS, the channels that actually created and nurtured the intent, get nothing.
Multiply that over a quarter, and the report says your closing channels are your revenue drivers, while your nurture channels are overhead. Budget follows the report. The channels that built the demand get cut. The next quarter’s pipeline weakens, and no one connects the two.
The Attribution Map: Three Lenses on the Journey
The Attribution Map doesn’t require a new platform or a data science team. It requires the event stream from the member view, read through three lenses for the members who actually converted.
Lens 1: First Touch
For each converting member, identify the channel that introduced them. Across your converting cohort, this tells you which channels are doing acquisition: bringing in people who eventually buy, even if those channels never get the last click.
First-touch is your acquisition engine. If a channel rarely closes but consistently introduces members who later convert, last-click has been hiding its value entirely. That’s the channel most at risk of being cut for the wrong reason.
Lens 2: Assists
This is the lens that last-click erases completely. For your converting members, catalog every channel that appeared at any point in their journey between first touch and purchase. These are the assists: the channels that moved the member along without closing.
The assist pattern is where the surprise usually lives. Across converting members, email and SMS typically drive far more revenue than last-click credits, because their role is to sustain and advance intent, not to be the final step. When you can show, member by member, that your most-cut channels appear in the majority of converting journeys, the budget conversation changes.
Lens 3: Last Touch
Last touch still matters; it’s just not the whole story. It tells you which channels are effective conversion surfaces: where members are when they’re ready to buy. Branded search, a direct return to the site, a final email: these close.
The correction isn’t to ignore the last touch. It’s to put it in context: this is your conversion surface, not your entire funnel. A channel can be a great closer and a poor acquirer, or vice versa. You only see the difference when you look at all three lenses together.
What the Map Produces
Directors who reallocate budget based on a multi-touch map rather than last-click may see meaningfully more DTC revenue from the same total spend. No new budget; the existing budget simply follows the actual path members take, rather than overweighting the final step.
There’s a second benefit that matters specifically for a Prestige Trailblazer Director: defensibility. When you can walk into a quarterly review with a map showing first touch, assists, and last touch by channel, you’re no longer defending a single number that a CFO can poke holes in. You’re showing the journey. That’s a stronger position, and it protects the programs that don’t happen to close.
This Quarter’s Action
Pull 25 converting members from the last quarter. For each, reconstruct the channel sequence from the event stream: first touch, every assist, and last touch. Tally how often each channel appears in each role.
You’ll produce a one-page map showing which channels acquire, which assist, and which close. Compare it to where your budget currently goes. The gap between the two is your reallocation opportunity, and it’s almost always larger than expected, because last-click has been hiding it all along.
Learn more about attribution mapping and how the multi-touch view can reveal which of your channels is most undervalued in your current reporting.
P.S. You don’t need perfect attribution to act; you need better attribution than last-click, which is a low bar. Even a manual map of 25 journeys will surface a channel that’s been mispriced in your reporting. Acting on a directionally correct map beats defending a precisely wrong one.
