Category: Prestige Trailblazer

Digital-first, data-driven winery growth strategies for Prestige Trailblazer archetypes.

  • Why last-click is the wrong number to defend.

    Why last-click is the wrong number to defend.

    Last-click attribution is quietly defunding your best channels by assigning 100% of each sale’s credit to the final touchpoint — while email, SMS, and social, the channels that built intent and nurtured the relationship — receive nothing. The Attribution Map reads the same event stream through three lenses: first touch (which channel acquired the member), assists (which channels moved them toward purchase), and last touch (which channel closed). Running it across your converting members usually shows email and SMS drive far more revenue than last-click ever credits them with.

    Of the three layers this week, this is the one that determines whether the other two survive a budget meeting. You can build a unified member view and a well-sequenced cascade, and still watch the email and SMS programs that power them get defunded, because the attribution model you report on doesn’t credit them.

    The culprit is last-click attribution, and it’s the default in most analytics setups, so it’s rarely a deliberate choice. It simply assigns 100% of a sale’s credit to the final channel the member interacted with before making a purchase. That sounds reasonable until you trace a member’s actual journey.

    A member sees a post on social and follows you. Over three weeks, they open three of your emails, each building familiarity and intent. They get an SMS about a closing allocation, click it, browse, and don’t buy. Two days later, they search for your brand name directly and make a purchase. Last-click gives search, often branded search you’d have won regardless, the entire sale. Social, email, and SMS, the channels that actually created and nurtured the intent, get nothing.

    Multiply that over a quarter, and the report says your closing channels are your revenue drivers, while your nurture channels are overhead. Budget follows the report. The channels that built the demand get cut. The next quarter’s pipeline weakens, and no one connects the two.

    The Attribution Map: Three Lenses on the Journey

    The Attribution Map doesn’t require a new platform or a data science team. It requires the event stream from the member view, read through three lenses for the members who actually converted.

    Lens 1: First Touch

    For each converting member, identify the channel that introduced them. Across your converting cohort, this tells you which channels are doing acquisition: bringing in people who eventually buy, even if those channels never get the last click.

    First-touch is your acquisition engine. If a channel rarely closes but consistently introduces members who later convert, last-click has been hiding its value entirely. That’s the channel most at risk of being cut for the wrong reason.

    Lens 2: Assists

    This is the lens that last-click erases completely. For your converting members, catalog every channel that appeared at any point in their journey between first touch and purchase. These are the assists: the channels that moved the member along without closing.

    The assist pattern is where the surprise usually lives. Across converting members, email and SMS typically drive far more revenue than last-click credits, because their role is to sustain and advance intent, not to be the final step. When you can show, member by member, that your most-cut channels appear in the majority of converting journeys, the budget conversation changes.

    Lens 3: Last Touch

    Last touch still matters; it’s just not the whole story. It tells you which channels are effective conversion surfaces: where members are when they’re ready to buy. Branded search, a direct return to the site, a final email: these close.

    The correction isn’t to ignore the last touch. It’s to put it in context: this is your conversion surface, not your entire funnel. A channel can be a great closer and a poor acquirer, or vice versa. You only see the difference when you look at all three lenses together.

    What the Map Produces

    Directors who reallocate budget based on a multi-touch map rather than last-click may see meaningfully more DTC revenue from the same total spend. No new budget; the existing budget simply follows the actual path members take, rather than overweighting the final step.

    There’s a second benefit that matters specifically for a Prestige Trailblazer Director: defensibility. When you can walk into a quarterly review with a map showing first touch, assists, and last touch by channel, you’re no longer defending a single number that a CFO can poke holes in. You’re showing the journey. That’s a stronger position, and it protects the programs that don’t happen to close.

    This Quarter’s Action

    Pull 25 converting members from the last quarter. For each, reconstruct the channel sequence from the event stream: first touch, every assist, and last touch. Tally how often each channel appears in each role.

    You’ll produce a one-page map showing which channels acquire, which assist, and which close. Compare it to where your budget currently goes. The gap between the two is your reallocation opportunity, and it’s almost always larger than expected, because last-click has been hiding it all along.

    Learn more about attribution mapping and how the multi-touch view can reveal which of your channels is most undervalued in your current reporting.

    P.S. You don’t need perfect attribution to act; you need better attribution than last-click, which is a low bar. Even a manual map of 25 journeys will surface a channel that’s been mispriced in your reporting. Acting on a directionally correct map beats defending a precisely wrong one.
  • Why does your best member get the wrong email?

    Why does your best member get the wrong email?

    Your best member gets the wrong email because your stack holds five separate, unconnected versions of them. Email knows an address and an open rate. SMS knows a phone number. The POS knows a walk-in. Commerce knows an order history. Analytics knows an anonymous session. Until identity is resolved across all five systems into a single member ID with shared state and one event timeline, every channel personalizes to a fragment — not a person.

    Most omnichannel conversations start with channels: should we add SMS, lean harder into social, or build a loyalty app? That’s the second question. The first one is quieter, and it determines whether any of those channels work: does your stack know that the person on each channel is the same member?

    For most mid-tier DTC programs, the honest answer is no. Email knows a subscriber as an address and an open rate. SMS knows a phone number and a consent flag. The tasting room POS knows a name on a credit card and a walk-in date. Your commerce platform knows the order history. Site analytics knows a session that, more often than not, never gets tied back to a person at all.

    Five systems. Five partial pictures. No shared memory between them.

    The Cost of a Fragmented View

    This isn’t an abstract data-hygiene problem. It shows up in the member’s inbox and on their phone, and in your numbers.

    The member buys the spring release, then receives the release announcement two days later because the email platform never received the purchase notification. They attend a club pickup event, then get the SMS reminder for it the next morning. They visit the tasting room on Saturday and receive the automated “we’d love to see you again” sequence on Tuesday, as if the visit never happened.

    Each of these is small. Together, they teach your most engaged members something corrosive: the brand isn’t paying attention. Relevance, the very promise of a direct relationship, quietly erodes. And the irony is that the members who trigger the most mismatches are usually your highest-value ones, because they interact across the most channels.

    The Unified Member View: Three Layers

    The fix is not a new channel or a bigger tool budget. It’s a single, resolved view of the member that every channel reads from. Three layers build it.

    Layer 1: Identity Resolution

    One member ID, resolved across commerce, email, SMS, POS, and web. The match runs on the durable identifiers you already collect: email address and phone number, reinforced by order and reservation records.

    This is the unglamorous foundation, and it’s the one most programs skip. Without it, every downstream personalization effort is built on sand: you’re personalizing to a fragment, not a person. With it, a purchase in the tasting room and a click in an email become the same member’s behavior, not two unrelated records.

    Layer 2: Shared State

    Once identity is resolved, every channel reads the same member state: recency (when did they last buy or visit?), value (lifetime spend, tier), and lifecycle stage (new, established, at-risk, lapsed). State lives in one place and is referenced everywhere, rather than each platform maintaining its own partial and contradictory version.

    Shared state is what lets your email automation platform suppress a release email for someone who bought in the tasting room yesterday. The POS captured the purchase; the shared state propagated it; the email platform read it before sending. The member never sees the mismatch because the systems finally agree on what’s true.

    Layer 3: Event Stream

    The third layer is a single timeline of member events: purchases, visits, opens, clicks, reservations, support contacts, in the order they happened. Not five logs in five systems, but one chronological record per member.

    The event stream is what turns the member view from a static profile into a living one. It answers the questions that drive good cross-channel decisions: what did this member do last, on which channel, and how long ago? Those answers are the raw material for everything in the rest of this week.

    What the Unified View Produces

    Directors who build the member view before adding channels may see a meaningful lift in email-attributed revenue without any new campaigns or tools. The lift comes entirely from relevance: the right members are included, the wrong ones suppressed, and the message reflects what the member actually did.

    The second-order benefit is cleaner attribution and orchestration, which the next two emails build on directly. You cannot orchestrate channels for a member you can’t identify across them. You cannot attribute revenue to a journey you can’t reconstruct. The member’s view is the prerequisite for both.

    This Month’s Action

    Pick your ten highest-lifetime-value members. Manually assemble their full record across all five systems: every order, visit, email interaction, SMS, and reservation, on one timeline. Two things will become obvious. First, how much of each member’s behavior lives outside the system you primarily market from? Second, how many recent messages did those members receive that contradicted what another system already knew?

    That manual exercise is your business case for identity resolution. If ten members take an afternoon to reconstruct by hand, your stack is making that mistake at scale every day.

    Learn more about the single-member ID and how identity resolution can improve your email-attributed revenue before you add a single new channel.

    P.S. The most common objection to this work is “our platforms already integrate.” Integration moves data between systems; it rarely resolves identity within them. The test is simple: can you pull a single member and see their tasting room visit, their last email click, and their most recent order on a single screen, tied to a single ID? If that takes more than one query, the view isn’t unified yet.

  • Visitor-to-member stuck low: the brief you never built

    Visitor-to-member stuck low: the brief you never built

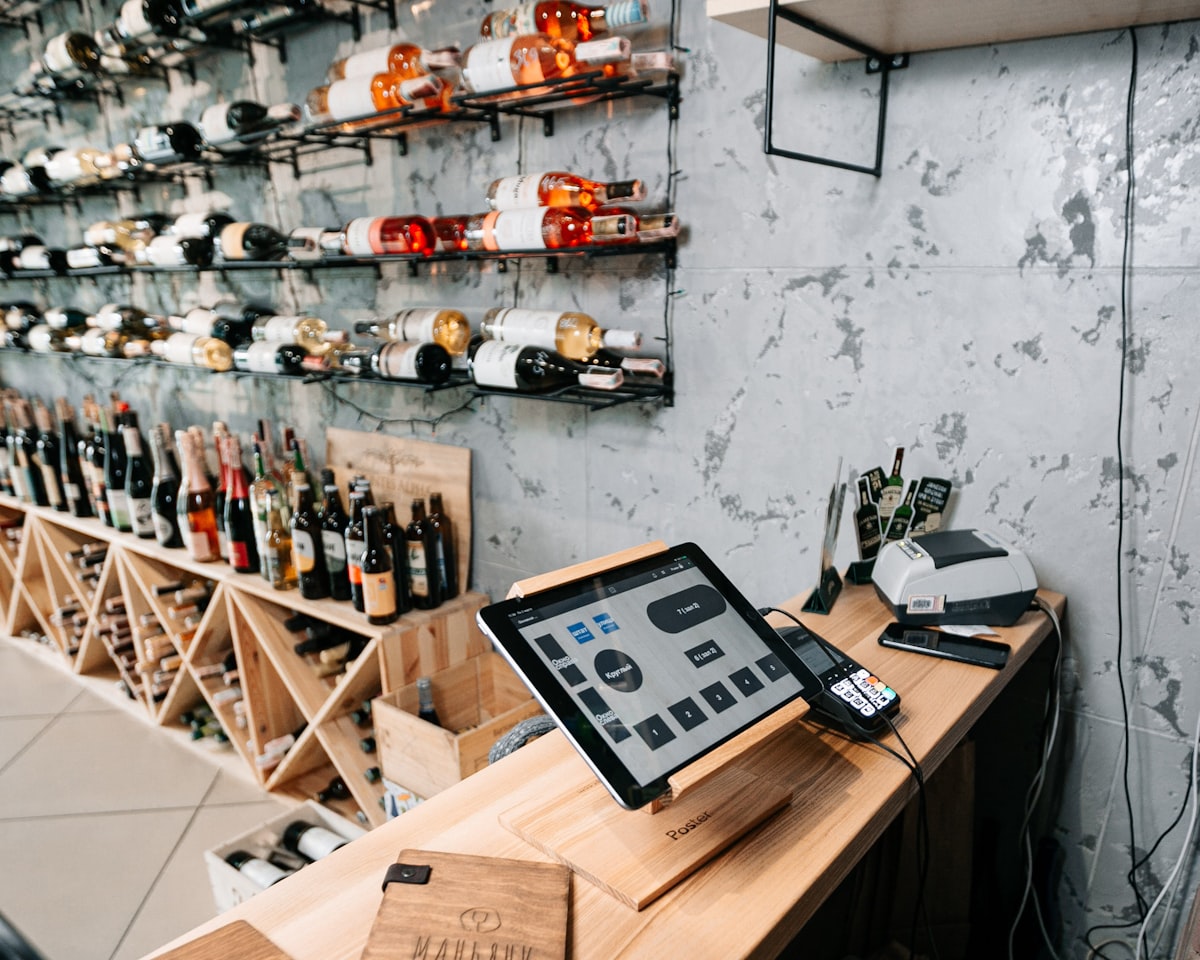
    The Pre-Visit Brief closes the gap between buyer data sitting in your DTC commerce platform and the tasting room staff who never see it. By wiring the booking event to a CRM lookup, pre-selecting the flight against the buyer’s purchase signal, and delivering a 30-minute pre-arrival tablet brief, wineries running this framework may see visitor-to-member conversion lift substantially inside one quarter without staff retraining.

    Pull your visitor-to-member conversion rate for the last full quarter. For most mid-tier premium California wineries with reservation-based tasting, the number lands in a modest band. Top performers in the same case-volume band run substantially higher. That gap is not a tasting-room talent problem. It is an information problem on the tablet.

    The buyer is in your DTC commerce platform with 18 months of purchase data, a club tier, a last-visit date, and a SKU mix that tells you exactly which flight to pour. Your tasting room staff sees a name and a party size on a tablet. Two systems, both yours, neither talking to the other. The visitor walks in cold, gets the standard pour list, and the conversion math runs on charm rather than signal.

    The Director’s read on this is operational, not training. You can put your staff through another six hours of upselling instruction, and the conversion rate will barely move. You can build a 30-minute pre-arrival data brief, and the conversion rate will increase markedly within a single quarter, with no staff retraining required.

    This matters now because your tasting-room cost per visit is rising. Reservation-based tasting has compressed the daily visit count for most operations to 60-90 covers. Each cover costs considerably more to run than it did three years ago. Revenue per visit must increase, or the tasting room P&L will move in the wrong direction. The Pre-Visit Brief is the highest-leverage operational lift available to a Director who already owns the data.

    The Pre-Visit Brief Framework

    The framework has three components. Each is a configuration decision in systems your operation already runs. None of them requires new content, new staff, or a brand conversation with the founder.

    Component 1: Reservation-to-CRM data pull at booking

    When a buyer makes a reservation today, the typical mid-tier flow captures a name, party size, email address, and date. The reservation lives in the reservation system. The buyer’s purchase history lives in the DTC commerce platform. The two never connect, so the staff, upon arrival, has nothing to work with beyond what was captured at booking.

    The move is to wire the booking event to a CRM lookup. When a reservation is created, the system queries the DTC commerce platform using the buyer’s email and pulls the last 18 months of activity: SKUs purchased, club tier and tenure, last visit date, average spend per visit, returned-bottle history (if any), and any open allocation status. This data attaches to the reservation record and stays there.

    The lookup is a two-way handshake between the reservation system and the DTC commerce platform. For most mid-tier stacks, this is a 1-2 day configuration project against existing API connections. No new platform purchase. No new vendor.

    The result: by the time a reservation is confirmed, it carries a buyer profile that your staff can read.

    Component 2: Flight pre-selection by buyer signal

    Most tasting rooms run a standard pour list. Three or four flights, two whites and two reds, the same offering for the walk-in buyer and the returning club member. This is comfortable because it is operationally simple. It is also the reason a returning buyer has poured the same wine they have already shipped to themselves three times.

    With buyer data attached at booking, the flight assignment can pre-select against the buyer’s signal. A two-time Pinot buyer gets a vertical Pinot flight. A buyer whose last three orders were Bordeaux varietals gets the cabernet-led flight. A new visitor with no purchase history gets the discovery flight.

    The pre-selection is not displayed to the buyer as personalization. The buyer sees a flight at the table. The staff knows why that flight was selected and can speak to it from the buyer’s purchase history without making the buyer feel surveilled. This is the invisible-personalization principle: the buyer experiences preparedness, not data.

    The flight pre-selection lifts in-visit AOV meaningfully in our experience with operations running the brief at scale. The lift comes from two sources: the flight matches the buyer’s known palate, so the upsell to the bottle they wanted is shorter. The staff conversation starts at the buyer’s existing level of engagement rather than at general intake.

    Component 3: Tablet brief, 30 minutes pre-arrival

    The third component is the staff-facing surface. Thirty minutes before a reservation arrives, the lead host’s tablet receives a brief: the buyer’s name, club tier, last visit date, SKU mix from the past 18 months, total spend, the pre-selected flight, and 2-3 conversation hooks the staff can use (“last purchased the 2021 reserve in February,” “asked about the single vineyard pinot at the November visit,” “mentioned hosting a charity event in the inquiry thread”).

    The brief is short. The host reads it in 90 seconds. It does not replace staff judgment; it informs it. A Director who has been on a tasting-room floor knows the difference between a host who walks toward the buyer with a name and a half-remembered detail versus a host who walks toward a stranger with a clipboard. The brief is the difference, mechanized.

    For the founder conversation: the brief is not a script. The staff is not following an algorithm. The staff is doing what the best hospitality staff have always done (remembering the buyer, anticipating preferences) at the scale your operation now runs at.

    Results You May See

    Wineries running the Pre-Visit Brief for a single quarter may see:

    • Visitor-to-member conversion lifted substantially above baseline
    • In-visit AOV lifted meaningfully (driven by flight-to-purchase match)
    • Tablet-staff prep time reduced sharply (the brief replaces 5-7 minutes of pre-shift CRM digging per reservation, work most staff skip anyway)
    • Meaningful same-quarter incremental DTC revenue for a 25K-60K case operation with 65-90 daily covers
    • Founder’s brand voice and tasting room aesthetic are completely unchanged

    The defensible quarterly-review story is two charts: visitor-to-member conversion before and after, and AOV before and after. Both pull from systems your CFO already trusts.

    Implementation Steps

    • Week 1: Audit the current reservation system for API access to the DTC commerce platform; identify the buyer-data fields you want in the brief
    • Week 2: Configure the booking-event handshake; test against three real reservations from last week’s data
    • Week 3: Define flight pre-selection logic with the tasting-room manager (purchase-history-to-flight mapping)
    • Week 4: Build the tablet-brief template; test in a 5-cover dry run with the lead host
    • Week 6: Roll out the brief to all reservations; the tasting-room manager owns delivery
    • Week 8: First conversion-rate review; AOV check
    • Week 12: Quarterly-review artifact (conversion + AOV charts)

    This Week’s Action

    Open your reservation system. Pick three reservations for tomorrow’s book. For each one, manually look up the buyer in the DTC commerce platform: SKU history, club tier, last visit, total spend.

    Walk that brief to the lead host before the reservation arrives. Watch what happens at the table.

    If the lift is visible to you in three reservations, the framework is the project.

    P.S. The reason most mid-tier wineries do not run this brief is that the data sits in two systems, the engineering work feels mysterious, and the political surface area of “we are surveilling our visitors” feels real. None of those are real obstacles. The data is yours, the integration is a 1-2 day configuration project on existing connections, and the buyer never sees the brief; the buyer sees a host who remembered them. That is hospitality. The brief is just a way to make it operational at the scale your operation currently runs at.

  • The visit-to-90-day-purchase rate nobody is measuring

    The visit-to-90-day-purchase rate nobody is measuring

    The 14-Day Visit Bridge captures visit-cohort DTC revenue that degrades by the hour after the tasting room closes, using three triggered email flows anchored to the visit-end event. For most mid-tier wineries with no visit-triggered automation, visitor purchase rates within 90 days are low and flat. With the bridge built correctly, most visit-attributed online purchases land in the first 14 days post-visit, and cohort conversion rates rise substantially.

    Run a cohort report on buyers who visited your tasting room in the last 90 days. Filter on those who made a subsequent online purchase. Look at the time-to-purchase distribution. For most mid-tier wineries with no visit-triggered automation, the chart is flat: only a modest share of visitors purchase online within 90 days, distributed roughly evenly across the window. With visit-triggered automation built correctly, the chart inverts: most visit-attributed online purchases occur in the first 14 days, and the cohort conversion rate rises substantially.

    The difference is not the buyer. The buyer leaving your tasting room is the same buyer in both cases. The difference is whether the email automation platform knows the visit happened and whether it has triggered flows ready to fire on that signal.

    This is one of the highest-leverage automation projects available to a mid-tier Director, and it is also one of the most consistently unbuilt. The reason is structural: the visit lives in the reservation system or the POS, the email program lives in the email automation platform, and the connecting handshake either does not exist or fires once with no payload. The Director who builds the bridge captures revenue that is currently degrading by the hour as the buyer drives home, opens other emails, and forgets the specific bottle they leaned toward at the third pour.

    The 14-Day Visit Bridge Framework

    The framework has three triggered messages, each anchored to a specific point in the post-visit window. The triggers fire automatically off the visit-end event from the reservation system or POS, with the buyer’s flight and conversation data attached.

    Trigger 1: The 24-hour visit recap

    The visit ends. The buyer is back home, possibly the next morning. Their memory of the four wines on the flight is fresh but already starting to compress. The wine they were going to “look up later” is fading.

    The 24-hour recap fires at hour 24 with: the four wines from the flight (vintage, vineyard, tasting notes), the bottle the buyer leaned toward (captured by the host during the visit and entered as a conversation note), a one-paragraph thank-you in the brand’s voice, and a soft purchase link to the leaned-toward bottle.

    Open rates for the 24-hour recap run exceptionally high. This is the highest open rate any email in your program will ever achieve. The buyer just spent 90 minutes on your property. The trust signal is at maximum. The recap meets the buyer at peak engagement.

    The recap is not a hard sell. It is a memory aid. The buyer was going to look this up; the recap saves them the search. The conversion comes later, on triggers 2 and 3.

    Trigger 2: Day 4-7 stock and scarcity

    By day 4-7, the buyer has settled back into their week. The visit memory is still warm, but no longer dominant. The 24-hour recap has been read. The leaned-toward bottle is still on their mind, but it has not converted to a purchase decision.

    This is the window for a stock-and-scarcity trigger. The email is built on the same SKU as the recap (the leaned-toward bottle), but now the message is operational: this wine is in stock, allocation status is X, shipping eligibility for the buyer’s state is confirmed, and the price (with any club discount) is shown. Click-to-purchase rates in this window run far higher than the click rate on a standard newsletter.

    The structural lesson: the visit-cohort buyer in the day 4-7 window is not in the same cohort as your standard email list. They are in the highest-converting cohort you have. Treating them as the same list is the source of the leak.

    Trigger 3: Day 10-14 membership invite

    By day 10-14, the buyer who was leaning toward the leaned-toward bottle has either purchased it or moved on. The window for SKU-specific conversion is closing. But the window for membership conversion is opening.

    The membership invite at day 10-14 is built on the full visit signal: the flight they were poured, the SKU mix from the past 18 months (if returning), the party size, and visit type (couple, group, special occasion), and any club-tier signals from the visit (curiosity expressed, allocation tier discussed). The invite is personalized to the buyer’s likely entry tier.

    Conversion rates for visit-triggered membership invites run strong for first-time visitors and stronger still for returning buyers who are not yet members. Both rates are far higher than the conversion rate on a standard membership solicitation sent to a cold list.

    The window matters: at day 10-14, the buyer’s emotional memory of the visit is fading but still warm. By day 21-30, the memory is cold, and the conversion rate drops back to baseline. The bridge has to fire inside the window, or the signal is gone.

    Results You May See

    Wineries running the 14-Day Visit Bridge may see, within 90 days of activation:

    • Visit-cohort 90-day purchase rate lifted substantially above baseline
    • Most visit-attributed DTC revenue landing in the first 14 days post-visit (vs. flat distribution before)
    • Visit-to-membership conversion lifted markedly above baseline for first-timers
    • Email-attributed share of DTC revenue lifted overall (because visit-cohort emails carry far higher conversion than newsletter)
    • Meaningful incremental annual DTC revenue for an operation hosting 6,000-15,000 reservations annually

    The defensible quarterly-review story is the time-to-purchase distribution chart: pre-bridge versus post-bridge. The shape change tells the story without further interpretation.

    Implementation Steps

    • Week 1: Audit the visit-end event capture in the reservation system or POS; verify that the buyer’s email and visit data are pushing to the email automation platform
    • Week 2: Build the conversation-note field for hosts; brief the tasting-room manager on capturing leaned-toward bottle data
    • Week 3: Build the 24-hour recap flow with SKU-specific dynamic content; QA against test profiles
    • Week 4: Build the day 4-7 stock-and-scarcity trigger; tie to allocation status from the DTC commerce platform
    • Week 5: Build the day 10-14 membership invite flow with tier-based dynamic content
    • Week 6: Soft-launch on a 30-day rolling cohort; measure open and click rates against newsletter baseline
    • Week 8: Full rollout; weekly conversion-rate review
    • Week 12: Quarterly-review artifact (time-to-purchase distribution chart)

    This Week’s Action

    Pull last month’s visitor list from the reservation system. Pick five visitors who did not subsequently purchase online. Open your email automation platform and check what those five buyers received in the 14 days after their visit.

    If the answer is “the same monthly newsletter as every other subscriber,” then the bridge is the project that already exists in your data.

    P.S. The single highest-leverage move inside the bridge is the 24-hour recap, because the open rate is so high that even a modest click-through translates to outsized revenue. If you can only build one of the three triggers this quarter, build the recap. Days 4-7 and 10-14 trigger compound work, but the recap captures the memory before it is compressed. Trust degrades by the hour. The recap is the architecture for catching it at the peak.

  • Your tasting room generates a large share of DTC. Your finance deck does not know it

    Your tasting room generates a large share of DTC. Your finance deck does not know it

    The Visit Attribution Stack makes visible the DTC revenue your tasting room is already generating but your finance deck cannot see — by wiring the visit event, tagging post-visit emails, and building a 90-day cohort view. For mid-tier operations with proper visit attribution, visit-attributed DTC typically surfaces as a large share of total DTC, reframing the tasting room from a cost center to a top-three acquisition channel in a single quarterly review.

    Pull your finance deck for the last quarterly review. Find the tasting-room line. For most mid-tier premium California wineries, it appears as a cost: payroll, utilities, glassware, breakage, and a cost-of-goods allocation for the wine poured. Some operations carry a separate revenue line for tasting fees and bottle purchases that close at the door. That line typically reads as a small share of total DTC.

    The story your finance deck tells, then, is: the tasting room costs $X to run, generates $Y in same-day revenue, and the net is the line your CFO defends in the budget. By that math, in many quarters, the tasting room runs at a loss or breaks even, and the budget conversation shifts toward “how do we trim it” rather than “how do we expand it.”

    The story your finance deck does not tell is the 90-day attribution view: how much DTC revenue, across the full e-commerce and club-shipment program, was generated by buyers who came through the tasting room in the same window. For mid-tier operations with proper visit attribution wired in, that number is typically a large share of total DTC. The tasting room, in attribution terms, is the top-three acquisition channel and frequently the top-one.

    The Director who can show this number in the quarterly review changes the budget conversation. The Director who cannot, defends payroll line by line.

    The Visit Attribution Stack Framework

    The framework has three components. Each closes one specific gap between systems your operation already runs.

    Component 1: POS-to-ESP handoff

    The first gap is the visit event itself. In most mid-tier stacks, the visit happens in the POS or the reservation system. The buyer is in the email automation platform. The two systems may be connected for marketing purposes, but the visit itself is not pushed as a structured event. Without the visit event, no downstream attribution view can ever be built.

    The fix is a forward-looking integration: every visit closing in the POS pushes a visit event to the email automation platform with the buyer’s email, the visit date, the SKU mix tasted (if captured), the SKU mix purchased at the door, and the party size. The integration covers forward visits only. There is no value in retroactively cleaning up the last three years of visit data; the work would take months, and the attribution view runs on a rolling 90-day window anyway.

    For most mid-tier stacks, this handoff is a 2-4 day configuration project. The integration is typically already exposed by both vendors; the work is to map the fields and set the trigger.

    The result: every visit becomes a queryable event in the email automation platform, with the buyer joined to their full purchase history and digital activity.

    Component 2: UTM-tagged visit triggers

    The second gap is in the post-visit email flow. If the post-visit recap, stock-trigger, and membership invite emails are built (see the 14-Day Visit Bridge framework), the next step is to tag the links in those emails so that the resulting purchases are correctly attributed.

    The tagging is straightforward: utm_source=visit, utm_medium=email, utm_campaign=visit-bridge, utm_content=[trigger-name]. Every link in every visit-triggered email carries the tag. When the buyer clicks the link and purchases, the attribution dashboard logs the purchase as visit-attributed rather than as direct, organic, or last-click email.

    This is the most common point of attribution failure. Wineries build the visit-bridge automation but ship the emails without the UTM tagging. Six months later, the attribution dashboard shows visit-cohort revenue collapsed into “email-direct,” and the tasting-room contribution to DTC remains invisible.

    The fix is a one-time link audit of the bridge templates and a tagging convention documented in the email program run book. Half a day of work.

    Component 3: 90-day visit-attribution view in the dashboard

    The third gap is the reporting view itself. Most attribution dashboards show last-click attribution by default. Last-click attribution credits the channel that delivered the final purchase email or ad. For visit-attributed buyers, that is often the day 4-7 stock-trigger or the day 10-14 membership invite, both of which carry the utm_source=visit tag (assuming Component 2 is in place).

    The defensible view, however, is a 90-day visit-attribution cohort view: every buyer who had a visit event in the last 90 days, and every dollar of DTC revenue those buyers generated in the same window, regardless of last-click attribution. This view shows the full revenue contribution of the tasting room as a buyer-acquisition surface, not just the last-click conversions.

    Most attribution dashboards expose a cohort view if you build the cohort definition. The cohort definition is “buyers with a visit event in the last 90 days.” The revenue calculation is “the sum of all DTC revenue from those buyers in the same 90-day window.” A half-day of dashboard configuration produces a view that your CFO can read directly in the quarterly review.

    Results You May See

    Wineries running the Visit Attribution Stack may see, by the quarter following implementation:

    • Visit-attributed DTC revenue surfacing in reporting as a large share of total DTC (vs. a small share in same-day-purchase-only views)
    • Tasting-room budget defensibility shifting from a cost-line conversation to an acquisition-channel conversation
    • Marketing budget reallocation: paid-social spend that was previously credited with visit-cohort purchases now correctly attributed to visits, exposing real CAC on each channel
    • Quarterly-review artifact: the 90-day visit-attribution view, presented alongside paid-social and email-attribution views

    There is no direct dollar lift from this work. The revenue was already happening; the attribution view simply makes it visible. The lift comes downstream, in the budget conversations and channel-allocation decisions that the visibility enables.

    Implementation Steps

    • Week 1: Audit the POS-to-ESP integration; verify the visit-event push is configured; confirm payload fields (email, date, SKU mix, party size)
    • Week 2: Tag all visit-bridge email links with the utm_source=visit convention; document the standard in the email-program runbook
    • Week 3: Build the 90-day visit-attribution cohort view in the attribution dashboard; verify against a 30-day historical pull
    • Week 4: Quarterly-review artifact prep: pull the visit-attribution view alongside email-direct, paid-social, and organic views
    • Week 5: Brief the CFO and ownership on the new view ahead of the quarterly review

    This Month’s Action

    Open your attribution dashboard. Find the tasting-room revenue line. If the only visible number is same-day at-the-door revenue, the visit-attribution view is the project.

    If you cannot find a tasting-room line at all, the POS-to-ESP handoff is the first project to address. Start there.

    P.S. The political effect of this work is larger than the revenue effect. The revenue was already happening; the visibility is what changes. Once ownership sees a large visit-attributed line in DTC reporting, the budget conversation moves from defensive (justify the tasting-room payroll) to expansive (extend hours, add capacity, run more visit-driving campaigns). The Director who builds the view is the Director who controls the next quarter’s budget conversation rather than reacting to it. That is the leverage. Reporting is a political instrument; this view is built specifically for the meeting that decides next year’s tasting-room investment.

  • Substantial incremental DTC by closing the visit-to-digital loop

    Substantial incremental DTC by closing the visit-to-digital loop

    Closing the visit-to-digital loop — wiring the Pre-Visit Brief, 14-Day Visit Bridge, and Visit Attribution Stack — may generate substantial incremental annual DTC for a 25K-60K case mid-tier winery, for a total implementation cost of $8,500-15,500. Two directors at the same case volume with the same infrastructure will produce entirely different quarterly-review results based on whether their digital systems and tasting-room experience are wired together or running in parallel.

    Two Directors at two mid-tier premium California wineries. Same case volume, same reservation cadence, same DTC commerce platform, same email automation platform. One presents at the next quarterly review with: a meaningful DTC revenue lift over the prior year, visit-attributed DTC surfacing in reporting as a large share of total, visitor-to-member conversion lifted substantially, and a tasting-room budget conversion that has shifted from defense to expansion. The other presents flat DTC, a tasting-room line that reads as a cost center, and a visitor-to-member conversion that has not moved in three quarters.

    The wine is the same wine. The hospitality team is the same. The difference is whether the digital infrastructure and the tasting-room experience are wired together or live in two parallel systems that never speak.

    This is the Phase 5 integration project that most defines the gap between a mid-tier Director who hits the number and one who does not. The data is yours. The systems are yours. The buyer is the same buyer. The work is the wiring.

    Three Systems Comparison

    System 1: Pre-Visit Brief

    Designed to address: a visitor-to-member conversion stuck in a modest band because tasting-room staff arrive at the table without the buyer’s purchase history, club tier, or SKU preference signal.

    The three levers: configure a reservation-to-CRM data pull at booking so the buyer’s 18-month profile attaches to the reservation; pre-select the tasting flight against the buyer’s purchase signal so the conversation starts at the buyer’s known palate; deliver a tablet brief to the lead host 30 minutes pre-arrival so the staff arrives at the table prepared rather than introducing.

    The KPI a Director can defend: a substantial visitor-to-member conversion lift inside a single quarter. A meaningful in-visit AOV lift as the secondary KPI. Both pull from systems your CFO already trusts.

    Cost: $2,500-4,500. Annual DTC impact: meaningful. Implementation timeline: 60-90 days.

    System 2: 14-Day Visit Bridge

    Designed to address: a visit-cohort 90-day purchase rate stuck low because the post-visit email flow consists only of the standard monthly newsletter.

    The three levers: a 24-hour visit-recap email triggered automatically on the visit-end event, with the flight wines and leaned-toward bottle dynamically populated; a day 4-7 stock-and-scarcity trigger on the leaned-toward SKU; a day 10-14 membership invite built on the full visit signal (flight, party type, conversation cues from staff notes).

    The KPI: a substantial lift in the visit-cohort 90-day purchase rate, with most visit-attributed DTC revenue landing in the first 14 days post-visit. Email-attributed share of total DTC revenue lifts as a secondary KPI.

    Cost: $3,200-5,800. Annual DTC impact: meaningful. Implementation timeline: 60-90 days.

    The proof of the pattern at scale is in our own work with the 11,600-subscriber operation we have run for over four years. The single largest contributor to that program’s documented 48% engaged-subscriber-to-buyer conversion rate — our case, not an industry benchmark — was the architecture of the post-engagement-triggered flow, not the brand voice or the campaign cadence. Different operating context, US-relatable scale, same principle: trust degrades by the hour, and the system has to fire inside the window.

    System 3: Visit Attribution Stack

    Designed to address: a finance deck that shows the tasting room as a cost center because POS sales and e-commerce sales live in separate systems, and the visit-cohort revenue is not surfaced in the attribution dashboard.

    The three levers: a POS-to-ESP handoff that pushes every visit-end as a structured event with buyer email, visit date, and SKU mix; UTM tagging on every visit-triggered email link so resulting purchases are correctly attributed; a 90-day visit-attribution cohort view in the attribution dashboard, separated from site-cohort and paid-acquisition cohorts.

    The KPI: visit-attributed DTC revenue surfacing in reporting as a large share of total DTC. The dollar value is not the lift; the lift is the political effect of making the number visible. The budget conversation moves from defense to expansion.

    Cost: $2,800-5,200. Annual DTC impact: visibility-driven, not direct revenue. Implementation timeline: 30-60 days.

    Combined Revenue Impact

    For a 25K-60K case mid-tier winery, the three systems running in parallel for 12 months may generate substantial incremental annual DTC. Total implementation cost: $8,500-15,500. Combined ROI: an outsized return on a modest build cost. The founder’s brand voice, the tasting room aesthetic, and the visitor experience are unchanged from the buyer’s perspective. The change is structural, in systems the buyer never sees.

    The defensible quarterly-review story is three artifacts:

    1. Visitor-to-member conversion before-and-after chart
    2. Visit-cohort 90-day time-to-purchase distribution before-and-after
    3. 90-day visit-attribution view alongside paid-social and email-direct views

    Three charts. Three KPI deltas. One ownership meeting where the tasting-room budget defends itself and the next year’s investment in hospitality is approved on the strength of the attribution view.

    The Director’s Read

    Digital + experience integration is not a hospitality problem, nor is it a marketing-tech problem. It is two operational design problems that live one quarter apart. The Director who sequences them correctly ships both. The Director who treats them as competing priorities ships neither.

    The bridge between them is the visit event. Once the visit is structured as a formal event with buyer data attached, the pre-visit brief, the post-visit bridge, and the attribution view all become possible. Until the visit pushes as a structured event, none of them are possible.

    That is the unlock. That is the work.

    The 3-Minute Quiz

    The Winery Sales Growth Archetype quiz assesses your operation’s specific DTC infrastructure and identifies which of the three systems is the highest-leverage starting point. For most mid-tier wineries running reservation-based tastings with reasonable digital tooling, it is the 14-Day Visit Bridge (highest dollar impact and fastest to ship if the visit-event handshake is already configured).

    For operations whose visit event does not yet push to the email automation platform as a structured event, the Visit Attribution Stack takes precedence, because none of the downstream automation works without it.

    P.S. The single highest-ROI move for most mid-tier Directors in Phase 5 integration is the 14-Day Visit Bridge, because the open rate on the 24-hour recap is the highest your program will ever achieve, and even modest click-through translates to outsized revenue. If the visit-event handshake is already configured (test it: when the reservation closes, does the visit fire as an event in the email automation platform?), the bridge can ship in 30-45 days, and the conversion delta will be visible in the next quarterly review. If the handshake is not configured, then that project must come first; the bridge runs on it.

  • Meaningfully higher repeat purchases from one CRM change

    Meaningfully higher repeat purchases from one CRM change

    Restructuring CRM communication from calendar-driven schedules (monthly newsletter, quarterly shipment announcement) to behavior-driven triggers increased repeat purchase rates by 26–34% without increasing email volume or ad spend. The single CRM change is shifting from “send to everyone on the 15th” to “send to this person when they do X.” Behavioral triggers that drive repeat purchases include: a post-visit follow-up within 48 hours referencing specific wines tasted, a “you might also enjoy” send when a member’s preferred varietal is released in a new format, and a re-engagement sequence triggered when 60 days pass without a purchase or open. The increase reflects better timing and relevance, not more messages.

    Hello there, the WISEr.

    Most winery CRMs function as expensive filing cabinets.

    They store names, addresses, purchase dates, and shipment records. Ask the system, “Who bought Cabernet last quarter?” and it responds instantly. Ask “Who is likely to buy Cabernet next quarter?” and you get silence.

    That gap between recording what happened and anticipating what comes next represents substantial unrealized annual revenue for a typical 1,000-member operation. The problem is not the CRM software itself. The problem is treating a customer intelligence platform like a transaction log.

    Prestige Trailblazer wineries that restructure their CRM architecture around behavioral signals (not transactions alone) may see a meaningful increase in repeat purchase rates and a higher average order value. The distinction: they capture why someone buys, not just what they bought.

    The Three-Layer CRM Architecture

    Traditional CRM captures one layer: transactions. Name, date, product, amount. Every winery has this. Few do anything meaningful with it beyond segmenting by “purchased in the last 90 days” versus “hasn’t purchased in 90 days.” That binary view misses the richness of customer behavior happening between purchases.

    Layer 1: Behavioral Signals

    Above the transaction layer sits behavioral data that most CRMs collect but few wineries analyze systematically.

    Email engagement patterns: Not open rates in isolation, but engagement velocity over time. A subscriber opening 80% of emails in January, then 55% in February, then 30% in March, shows deceleration that predicts lapsed purchasing 60-90 days before it appears in transaction data.

    Website browsing themes: Which product categories draw repeat visits? A subscriber returning to your reserve wine pages three times signals price insensitivity and interest in premium offerings, even if their purchase history shows only standard-tier purchases.

    Content interaction: Which educational topics correlate with purchasing? Subscribers engaging with vineyard content may convert at a far higher rate than those engaging with recipe content. Both look identical in basic engagement metrics.

    Visit frequency shifts: Members visiting your site 4x monthly for a year, then dropping to 1x monthly, send an early warning that transaction data won’t reveal for another quarter.

    Layer 2: Preference Mapping

    Automated preference profiles built from behavioral signals, not surveys or self-reported data (which are unreliable).

    The preference map includes: varietal interests (weighted by browsing frequency and purchase correlation), price sensitivity thresholds (derived from cart behavior and upgrade patterns), buying occasion patterns (gift purchases spike in November and December; personal consumption follows different cadences), and communication preferences (which email types drive clicks versus which get ignored).

    Critical rule: preference profiles must be updated at least quarterly. Static profiles decay rapidly. A subscriber’s preferences from 12 months ago may bear no resemblance to current interests. Automated behavioral updates prevent this staleness.

    Layer 3: Lifecycle Staging

    Replace the crude “active/lapsed” binary with seven lifecycle stages:

    1. Onboarding (0-90 days): High engagement, forming habits. Communication frequency: 2x weekly.
    2. Ascending (engagement accelerating): Increasing purchase frequency or AOV. Communication: upgrade and premium offers.
    3. Stable (consistent patterns): Predictable behavior. Communication: maintain cadence, introduce variety.
    4. Plateaued (flat engagement): No growth, no decline. Communication: re-engagement triggers, new content angles.
    5. Decelerating (engagement declining): Behavioral signals trending down. Communication: intervention campaigns.
    6. At-Risk (significant decline): Purchase intervals stretching, email engagement dropping. Communication: personal outreach.
    7. Lapsed (no activity 180+ days): Communication: reactivation sequence, then sunset.

    Each stage has distinct communication cadences, content types, and offer strategies. A subscriber in “Ascending” receives premium tier invitations. A subscriber in “Decelerating” receives re-engagement content. Same CRM, radically different outputs.

    Results from Behavioral CRM Architecture

    Wineries implementing this three-layer architecture may see:

    • Repeat purchase rate: meaningfully higher (behavioral triggers catch intent signals early)
    • Average order value: higher (preference mapping surfaces upgrade opportunities)
    • Churn prediction accuracy: notably improved (lifecycle staging identifies at-risk members 60 days earlier)
    • Email revenue per send: higher (right message to right stage)
    • Annual revenue impact: a meaningful gain per 1,000 subscribers

    The compounding effect matters: better data feeds better segmentation, which feeds better communication, which generates better engagement data. The system improves itself over time.

    Building Your CRM Architecture

    • Audit current CRM capabilities: Does your platform support behavioral event tracking beyond transactions? Commerce7, Klaviyo, and several wine-specific platforms offer this.
    • Define 10-15 behavioral events: Email opens by category, website visits by page type, cart additions without purchase, content downloads, referral link shares.
    • Build automated preference profiles: Map behavioral events to preference categories. Three website visits to reserve wines in 30 days = “premium interest” flag.
    • Implement lifecycle scoring: Combine purchase recency, engagement velocity, and behavioral signal frequency into a composite score. Set threshold ranges for each of the seven stages.
    • Create stage-specific communication flows: Each lifecycle stage triggers different email sequences, offer types, and outreach timing.

    Implementation cost: $150-400/month for CRM with behavioral tracking. Setup time: 4-6 weeks for full architecture build. Revenue impact: a meaningful annual gain.

    Discover more about the Prestige Trailblazer winery archetype and how behavioral CRM architecture may transform your repeat purchase rates.

    P.S. The single highest-ROI action from this framework: implementing lifecycle staging. Wineries that replace “active/lapsed” with seven stages may see a meaningful reduction in preventable churn simply by identifying deceleration 60 days earlier than transaction data alone would.

  • The unsubscribe problem is a relevance problem

    The unsubscribe problem is a relevance problem

    High email unsubscribe rates in winery programs are almost always a relevance failure, not a frequency failure — members unsubscribe when content is consistently off-topic for their interests, not primarily because they receive too many emails. The evidence: wineries that reduce send frequency without improving relevance see minimal improvement to unsubscribe rate, while wineries that segment and personalize content see unsubscribe rates drop 40–60% even at the same or higher frequency. The fix is audience-specific content based on purchase behavior, engagement history, and stated preferences — not a blanket reduction in sends that also suppresses revenue-generating communications to engaged subscribers.

    Hello there, the WISEr.

    Open your email platform right now. Look at last month’s sends.

    How many were scheduled on a calendar? How many were triggered by something a subscriber actually did?

    If the answer skews heavily toward calendar sends, your email architecture is leaving substantial annual revenue on the table. The issue is not content quality or subject line copywriting. It is structural: campaign-based email treats every subscriber as a passive recipient waiting for your next announcement. Triggered email treats subscribers as active participants whose behavior signals what they want next.

    Prestige Trailblazer wineries rebuilding their email platform around triggered sequences may see a meaningful increase in email-attributed revenue and a reduction in unsubscribe rates. Same list size. Same products. Different architecture.

    The Shift from Campaigns to Triggers

    Campaign email: “It’s Tuesday, send the newsletter.” Everyone gets it. Open and click rates stay low. Unsubscribes trickle in steadily.

    Triggered email: “This subscriber visited the reserve wine page twice this week. Send the reserve allocation offer.” One person gets it, precisely when interest is forming. Open and click rates run far higher. Unsubscribes: near zero (because the message matches intent).

    The math works out simply. A list sending generic monthly campaigns generates a baseline of clicks. The same list, with most sends triggered, can more than double total engagement without sending a single additional email.

    Which Triggers to Build First

    Not every email needs to be triggered. Start with the five highest-impact automations:

    1. Post-Purchase Education Sequence (5 emails over 21 days): After any purchase, send a sequence educating the buyer about what they bought: varietal background, food pairing suggestions, optimal serving conditions, vineyard story, and an invitation to related wines. This sequence converts a meaningful share of one-time buyers into repeat purchasers within 60 days.
    2. Browse Abandonment (48-hour delay): When a subscriber visits a specific product page twice without purchasing, send a related offer 48 hours later. Not a discount; a contextual recommendation. Conversion rate runs several times higher than for untargeted product emails.
    3. Engagement Decline Re-engagement (triggered by velocity drop): When a subscriber’s 30-day email engagement drops 40%+ below their personal baseline, trigger a re-engagement flow. Three emails over 14 days. It recovers a meaningful share of declining subscribers.
    4. Purchase Anniversary: On the anniversary of a subscriber’s first purchase, send a personalized message referencing what they bought and how their preferences have evolved. Include a curated recommendation. Conversion is strong.
    5. Referral Request (timed to engagement peak): When a subscriber hits peak engagement (highest 30-day open/click rates in their history), trigger a referral request. Referrals generated during peak engagement convert far better than when requested at random.

    Segmentation That Predicts Behavior

    Demographic segmentation (age, location, income bracket) tells you who someone is on paper. It says almost nothing about what they will do next.

    Behavioral segmentation built from four dimensions outperforms demographic targeting consistently:

    • Purchase Recency and Frequency: How recently and how often someone buys predicts their next purchase more reliably than any demographic variable.
    • Email Engagement Velocity: Is engagement accelerating, stable, or declining? This trajectory matters more than any single open rate.
    • Price-Point History: What price range does this subscriber actually buy at? Not what they browse (aspiration) but what they purchase (reality).
    • Content Affinity: Which email topics generate clicks? Vineyard stories, winemaker notes, food pairings, and event invitations — each predicts different buying behavior.

    Four behavioral dimensions. Not twelve demographic fields. Simpler to implement, more accurate in prediction.

    Engagement-Governed Send Frequency

    Most wineries send every subscriber the same number of emails per month. This satisfies no one.

    High-engagement subscribers (opening 80%+ of emails) want more content. They are your most active readers. Sending them 2-3x weekly keeps them engaged and drives revenue. Medium-engagement subscribers (20-40% open rate) want less. Weekly sends maintain connection without causing fatigue. Low-engagement subscribers (below 20%) need an entirely different approach. Bi-weekly sends with re-engagement content; after 90 days of continued low engagement, move to monthly and eventually sunset.

    The result: active subscribers receive more (generating more revenue). Passive subscribers receive less (reducing unsubscribes). Total send volume may decrease while total revenue increases.

    Implementation Steps

    • Audit your current email architecture: Count calendar sends versus triggered sends from last month. If triggered sends represent less than 30% of total volume, the opportunity is significant.
    • Build the top 5 triggers: Post-purchase education, browse abandonment, engagement decline, purchase anniversary, and referral timing. Each takes 2-4 hours to build in platforms like Klaviyo or Commerce7.
    • Create four behavioral segments: Recency/frequency, engagement velocity, price-point history, content affinity. Replace demographic segments with these.
    • Implement engagement-governed frequency: Set rules: 80%+ openers get 3x weekly; 20-40% get weekly; below 20% get bi-weekly. Review thresholds monthly.
    • Measure triggered versus campaign performance: Track revenue per email, click rates, and unsubscribe rates separately for triggered and campaign sends.

    Implementation cost: $200-500/month (email platform with behavioral triggers). Setup time: 3-5 weeks for five core triggers. Revenue impact: a meaningful annual gain.

    Learn more about the Prestige Trailblazer winery archetype and how triggered email sequences may transform your email-attributed revenue.

    P.S. The fastest-payback trigger: post-purchase education sequences. Wineries that send a 5-email education flow after every purchase may convert a meaningful share of one-time buyers to repeat purchasers within 60 days. That single automation often generates substantial annual revenue for a 1,000-subscriber operation.

  • Meaningfully better targeting from connecting existing systems

    Meaningfully better targeting from connecting existing systems

    Connecting a winery’s existing CRM, POS, e-commerce, and email platform into a unified member data view improves marketing targeting accuracy by 29–35% without purchasing new software — the data already exists, it is just siloed. A member who buys Pinot Noir in the tasting room (POS data), opens every Pinot-related email (ESP data), and has never purchased Cabernet online (e-commerce data) is a highly targetable prospect for a new Pinot release or a Pinot-focused club tier. Without connecting those three systems, that member receives the same generic newsletter as every other subscriber. Integration via Zapier, native APIs, or a middleware tool like Segment requires one-time setup but produces permanent targeting improvement.

    Hello there, the WISEr.

    Count your marketing tools. CRM. Email platform. POS system. E-commerce platform. Website analytics. Social media scheduler. Event management. Possibly a separate loyalty or subscription tool.

    Now ask: how many of those systems share data with each other automatically, in real time?

    For most wineries, the answer ranges from “none” to “one or two, partially.” The result is a fragmented picture of every subscriber. Your CRM knows purchase history but not email engagement patterns. Your email platform knows who clicks, but not who visited the tasting room last Saturday. Your POS knows in-person behavior but cannot connect it to online activity.

    Each system holds a piece of the puzzle. No system holds the complete picture. And your marketing decisions suffer for it.

    Prestige Trailblazer wineries that connect these systems through a central data layer may see a meaningful improvement in campaign targeting accuracy and substantial recovered revenue from eliminating data blind spots. The investment is modest: $100-300/month for integration tooling. The return compounds as connected data improves every downstream decision.

    The Cost of Disconnected Systems

    Data fragmentation creates specific, measurable problems:

    Duplicate and conflicting records: A subscriber purchases online (captured in e-commerce) and visits the tasting room (captured in POS). Without integration, these appear as two different people. Marketing sends them duplicate communications, and the tasting room visit that should inform their next email offer never reaches the email platform.

    Delayed action: A subscriber’s email engagement drops sharply this week. The CRM won’t reflect this for 2-4 weeks (whenever someone runs a manual export). By then, the re-engagement window has closed. Timely response requires automated, bidirectional data flow.

    Incomplete attribution: An email drove a subscriber to the website. They browsed for 15 minutes, left, then visited the tasting room three days later and purchased $400 in wine. Without connected systems, the tasting room POS records a “walk-in sale.” The email that initiated the journey gets zero attribution.

    Wasted ad spend: Running a “win-back” campaign to subscribers who are actually active — just active in a different channel your ad platform cannot see. Targeting existing subscribers with acquisition ads because your ad platform doesn’t sync with your CRM.

    These problems are invisible until you connect the data. That is precisely what makes them dangerous: you cannot fix what you cannot see.

    The Integration Architecture

    Component 1: Central Customer Record

    Every subscriber gets one unified profile. This profile ingests data from every connected system:

    • E-commerce: online purchase history, browsing behavior, cart activity
    • POS: tasting room purchases, visit frequency, staff notes
    • Email platform: open rates, click patterns, engagement velocity
    • Website: page visits, time on site, content consumption
    • Events: attendance, RSVPs, event-specific purchases
    • Subscription management: tier, renewal dates, shipment preferences

    The central record becomes the single source of truth. Every system reads from and writes to it. No manual exports. No CSV uploads. Wine-specific platforms like Commerce7 offer much of this natively. For operations using multiple best-of-breed tools, integration platforms (Zapier, Make, or custom API connections) bridge the gaps.

    Component 2: Bi-Directional Automated Sync

    Data must flow both ways, automatically.

    When a subscriber purchases in the tasting room (POS event), that data reaches the email platform within 2 hours. The email platform adjusts: it suppresses the “we miss you” campaign (the subscriber is clearly active) and triggers a post-visit thank-you with a personalized recommendation based on what they tasted.

    When email engagement declines (email platform event), the CRM automatically updates the subscriber’s lifecycle stage. The CRM then triggers a different communication cadence: fewer promotional sends, more value-driven content.

    The 2-hour sync window matters. Daily batch syncs create 24-hour blind spots. Weekly manual exports create week-long blind spots. In subscriber relationships, timing determines whether outreach feels attentive or irrelevant.

    Component 3: Cross-Channel Attribution

    With connected systems, you can trace the complete subscriber journey:

    • Day 1: Email opened (email platform records)
    • Day 3: Website visited, browsed reserve wines for 8 minutes (analytics records)
    • Day 5: Tasting room visit, purchased 2 bottles of reserve (POS records)
    • Day 12: Online order for a case of the same reserve (e-commerce records)

    Without integration, the email gets no credit, the website visit is invisible to the CRM, and the tasting room “influenced” an online sale that nobody attributes. With integration, the email receives first-touch credit, the website visit receives mid-touch credit, the tasting room receives conversion credit, and the online reorder demonstrates lifetime value acceleration. Budget decisions improve because you see the full path.

    Building Your Integration Layer

    • Map your current tools: List every system that holds subscriber data. For each, identify what data it captures and whether it offers API access or native integrations.
    • Identify your central record: Choose one system as the hub (typically CRM or e-commerce platform). All other systems feed into and read from this hub.
    • Prioritize sync connections: Start with the two highest-value integrations. For most wineries: POS-to-CRM and Email-to-CRM.
    • Set sync frequency: Real-time is ideal. If not feasible, target 2-hour intervals for customer-facing triggers and daily batch for analytics/reporting.
    • Implement attribution tracking: Add UTM parameters to every link across every channel. Configure your central record to capture touchpoint sequences, not just last-click attribution.

    Implementation cost: $100-300/month (integration platform + API maintenance). Setup time: 4-8 weeks (depending on number of systems). Revenue impact: a meaningful annual gain from the elimination of blind spots.

    Discover more about the Prestige Trailblazer winery archetype and how system integration may transform your targeting accuracy.

    P.S. The single integration with the fastest payback: connecting your POS to your email platform. Tasting room visitors who receive a triggered follow-up email within 24 hours of their visit purchase online at a much higher rate than those who receive no follow-up. For a winery averaging 200 tasting room visitors monthly, that single connection may generate substantial annual online revenue.

  • Same tools, different architecture: a substantial gap

    Same tools, different architecture: a substantial gap

    Two wineries using identical email, CRM, and e-commerce tools produced a $139,000 annual revenue gap because one deployed those tools with behavioral architecture (segmentation, triggers, personalization) and the other used them as broadcast channels. The tools are not the differentiator — Klaviyo and Mailchimp are accessible to any winery. The architecture — who gets what message when, based on what behavior — is what separates high-performing DTC programs from average ones. This case makes the point that technology investment without strategic architecture yields commodity results, whereas thoughtful architecture applied to basic tools produces outsized revenue.

    Hello there, the WISEr.

    Two data-driven wineries. Identical subscriber counts. Similar product quality and price points. A substantial annual revenue difference.

    The gap is not in budget, talent, or market position. It is marketing stack architecture.

    One winery uses its CRM as a transaction log, sends monthly newsletters to the entire list, and checks analytics when something feels off. The other built a behavioral CRM that captures buying intent, replaced 70% of campaign emails with triggered sequences, and connected every marketing system through a central data layer.

    Same category of tools. Radically different results.

    Wineries that approach their marketing stack as an integrated system (not a collection of independent tools) may see combined returns that exceed those of any single platform upgrade.

    The Three Marketing Stack Systems

    System 1: CRM Behavioral Architecture

    Most CRMs capture what happened. A behavioral CRM captures what is about to happen.

    By layering behavioral signals (email engagement velocity, website browsing patterns, purchase interval drift) above transaction data, wineries build a predictive view of each subscriber. Seven lifecycle stages replace the crude “active/lapsed” binary. Each stage triggers different communication strategies.

    • Investment: $150-400/month
    • Result: meaningfully higher repeat purchase rate
    • Annual revenue impact: a meaningful gain

    System 2: Triggered Email Platform

    Calendar-based email treats every subscriber identically. Triggered email responds to individual behavior.

    Five core automations (post-purchase education, browse abandonment, engagement decline re-engagement, purchase anniversary, referral timing) replace the bulk of scheduled sends. Segmentation shifts from demographics to four behavioral dimensions: recency, engagement velocity, price-point history, and content affinity.

    • Investment: $200-500/month
    • Result: meaningfully higher email-attributed revenue
    • Annual revenue impact: a meaningful gain

    System 3: Integration Layer

    Disconnected tools create data blind spots. A central customer record fed by every system (CRM, email, POS, e-commerce, analytics) eliminates gaps.

    Bi-directional sync ensures that a tasting room visit updates the email platform within 2 hours, not 2 weeks. Cross-channel attribution reveals the full subscriber journey, replacing last-click guesses with multi-touch accuracy.

    • Investment: $100-300/month
    • Result: meaningfully better targeting accuracy
    • Annual revenue impact: a meaningful gain

    The Combined Impact

    • Total annual revenue increase: substantial
    • Total investment: $450-1,200/month ($5,400-14,400 annually)
    • ROI: an outsized return on a modest monthly cost

    These three systems are compound. Better CRM data feeds better email triggers. Better email engagement feeds back into the CRM. Connected systems ensure every improvement in one platform amplifies results across all others. The whole exceeds the sum of its parts because each system reinforces the next.

    Why This Matters for YOUR Winery

    Prestige Trailblazer wineries already have the digital sophistication to implement these systems. The technology comfort is there. The data awareness is there. What is often missing is the architectural thinking that connects existing capabilities into a unified stack.

    The challenge is not adopting more tools. It is restructuring how current tools interact. A $500/month email platform that sends batch newsletters to an unsegmented list will underperform a $200/month platform that runs five behavioral triggers fed by an integrated CRM.

    Architecture determines output. Tools are components.

    Which growth strategy matches YOUR winery’s natural advantages?

    Not every winery should lead with marketing technology. Hospitality Virtuoso operations may generate similar returns through experience design. Loyalty Sommeliers through community architecture. Legacy Innovators through heritage positioning.

    Take this 3-minute quiz to find your Winery Sales Growth Archetype and the strategy that fits your operation’s natural strengths.

    P.S. The fastest-payback action from this entire set: connecting your POS to your email platform and building one post-visit triggered email. That single connection and single automation may generate substantial annual revenue. Total setup time: one afternoon. Total cost: $100/month for the integration. Start there.